Hi there, fellow project managers and Jira fans! You know how important it is to have the right information for your projects, and Jira is where you can find it. Today, we’re going to show you how to make the best use of Jira reporting, turning data into insights that help you make smart decisions.
How to Get Started with Jira Reporting and Make It Work for You
Jira reporting is more than just numbers and charts; it’s a way to tell the story of how your project is going. Before we get into the nitty-gritty, let’s see why mastering Jira reporting is important for guiding your projects in the right direction.
Why Jira Reporting Matters?
Jira reporting gives you a big picture of how your project is doing. It helps you to see how far you’ve come, where you might get stuck, and what you might face ahead. It’s like a map in the ocean of project data, showing you the way to finish your project successfully.
How to Create Meaningful Reports
1. Customizing Reports to Fit Your Narrative:
Reports should help you tell the story of your project. Find out how to make Jira reports your own by choosing the metrics that matter most to your team. Make reports fit your project goals and use them to share your project story in a captivating way.
2. Unveiling Built-in Widgets:
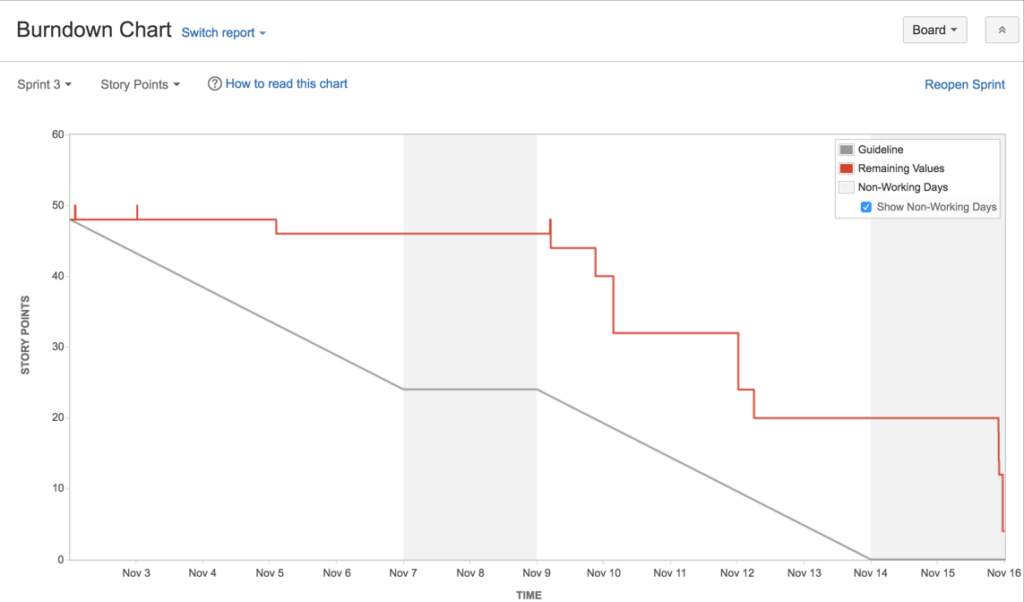
Jira has a lot of widgets that can make your reports more fun and lively. You can choose from different kinds of widgets, like burndown charts to show how fast you’re working, or heatmaps to show where you’re spending most of your time. Also, you can use Jira Marketplace plugins to generate more complex reports. For example, Jira Release Notes Plugin allows you to generate completed team work separated by each team member.
3. The Power of JQL: Using Advanced Queries to Enhance Your Data Analysis
Jira Query Language (JQL) lets you do more with your queries. You can explore the world of JQL and learn how to make queries that show you specific insights. You can use JQL to filter issues, track changes, or spot trends. JQL is your tool to find the hidden gems in your data.
How to Use Data to Make Better Decisions: A Practical Guide
1. Identifying Trends and Patterns:
Find out how to see trends and patterns in your data. You can learn things like when you work best, or what might slow you down. To turn data into insights that you can use, you need to understand the story your data is telling you.
2. Forecasting with Data:
Learn how to use past data to make good guesses about the future of your project. Learn how to use Jira reporting to see what might happen next, so you can plan and change things ahead of time.
3. Real-time Decision-Making:
Project management is a fast-moving world, and you need to make decisions quickly. Find out how to set up dashboards that show you the latest insights, so you can make smart choices on the spot.
Reporting Challenges and How to Solve Them: Tips for Stress-Free Reporting
1. Data Overload: Streamlining Your Reports:
Too much data can make you confused. We’ll give you some tips on how to make your reports simpler, showing only the most important information to keep your team on track.
2. Ensuring Data Accuracy: Quality over Quantity:
Good data is the key to good reports. Find out how to make sure your data is accurate in Jira, and avoid common mistakes that might make your insights less trustworthy.
3. User Adoption: Making Reports Accessible and Understandable:
Your reports won’t help much if your team can’t understand them. Learn how to make your reports clear and easy to use, so your team can get on board and get involved.
Conclusion: How Jira Reporting Can Help You Achieve Your Project Goals
Jira reporting is a way to show how well your project is doing. When you master Jira reporting, you can turn data into a useful resource, helping your team make better decisions and finish your project successfully. Come with us on this exciting journey, as we show you the secrets of Jira reporting, turning your data into insights that you can use to improve your project management skills.
Example of Jira Burndown Chart